 Are you sick of losing money on stocks that are supposedly ‘guaranteed winners’? How would you like to invest your money in a stock that just keeps on rising?
You’ll never want to pull your money out if the gains keep coming in.
In our current bull market, there are a lot of stocks with this kind of potential, but I want to pinpoint a special stock for you so you can be on your way to financial freedom.
There are so many stock picks thrown around each day that it must be overwhelming for someone who doesn’t know how to spot the stocks with the most upside potential.
There are so many skeptics that think analyzing stock charts is a waste of time. They believe that the stock market is as random as the lottery.
As I’ve proven time and time again, this simply isn’t true. The stock market functions on patterns and rhythms that become very simple to understand if they’re explained the right way.
These patterns are the reason we’re able to make healthy profits before the stock begins to turn south.
Look at the chart for Netflix (NFLX) for example:
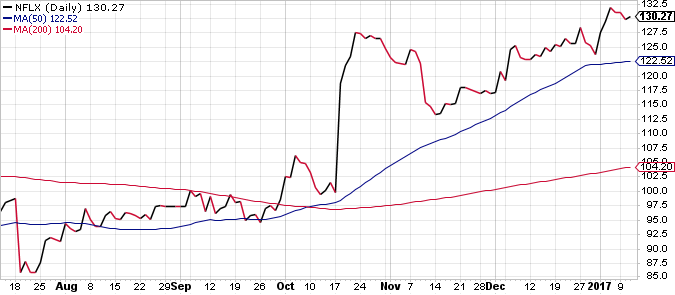
At first glance, it might look like a daunting prospect, but there was something very telling that happened in September.
The two colored lines on the chart indicate the average price of the stock over different time periods—the red is 200 days; the blue is 50 days—known as moving averages.
Take a look at the chart again and take notice of the two lines that I’ve drawn where the 200-day moving average and the 50-day moving average begin their collision course.
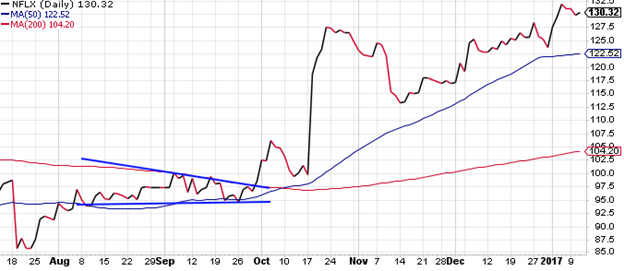
The blue lines I’ve drawn show the two moving averages squeezing the price of NFLX into a contracting space.
This pressure creates a sort of spring effect that is destined to catapult the stock drastically one way or the other.
As you can see, this wedge was very positive for NFLX, as it launched the stock to its highest ever price on January 6th.
The opportunity that could’ve made you a nice 35% profit came when the stock broke up above the 200-day moving average in late September.
These patterns form time and time again, and most of the time you’ll see repetitive patterns form in the same stocks—that’s where you really make the money.
Keep an eye on NFLX in the near future as it continues to rise. The tell-tale signs will be seen in this chart again, and your ticket to freedom could be in your hands sooner than you think.